Image science, beautifully simple

Images become
evidence.

Analyze scientific images, segment large datasets with artificial intelligence, and extract quantitative data. Use only the modules your research needs.

Get it from Microsoft
macOS coming soon
RGBMultispectralHyperspectral
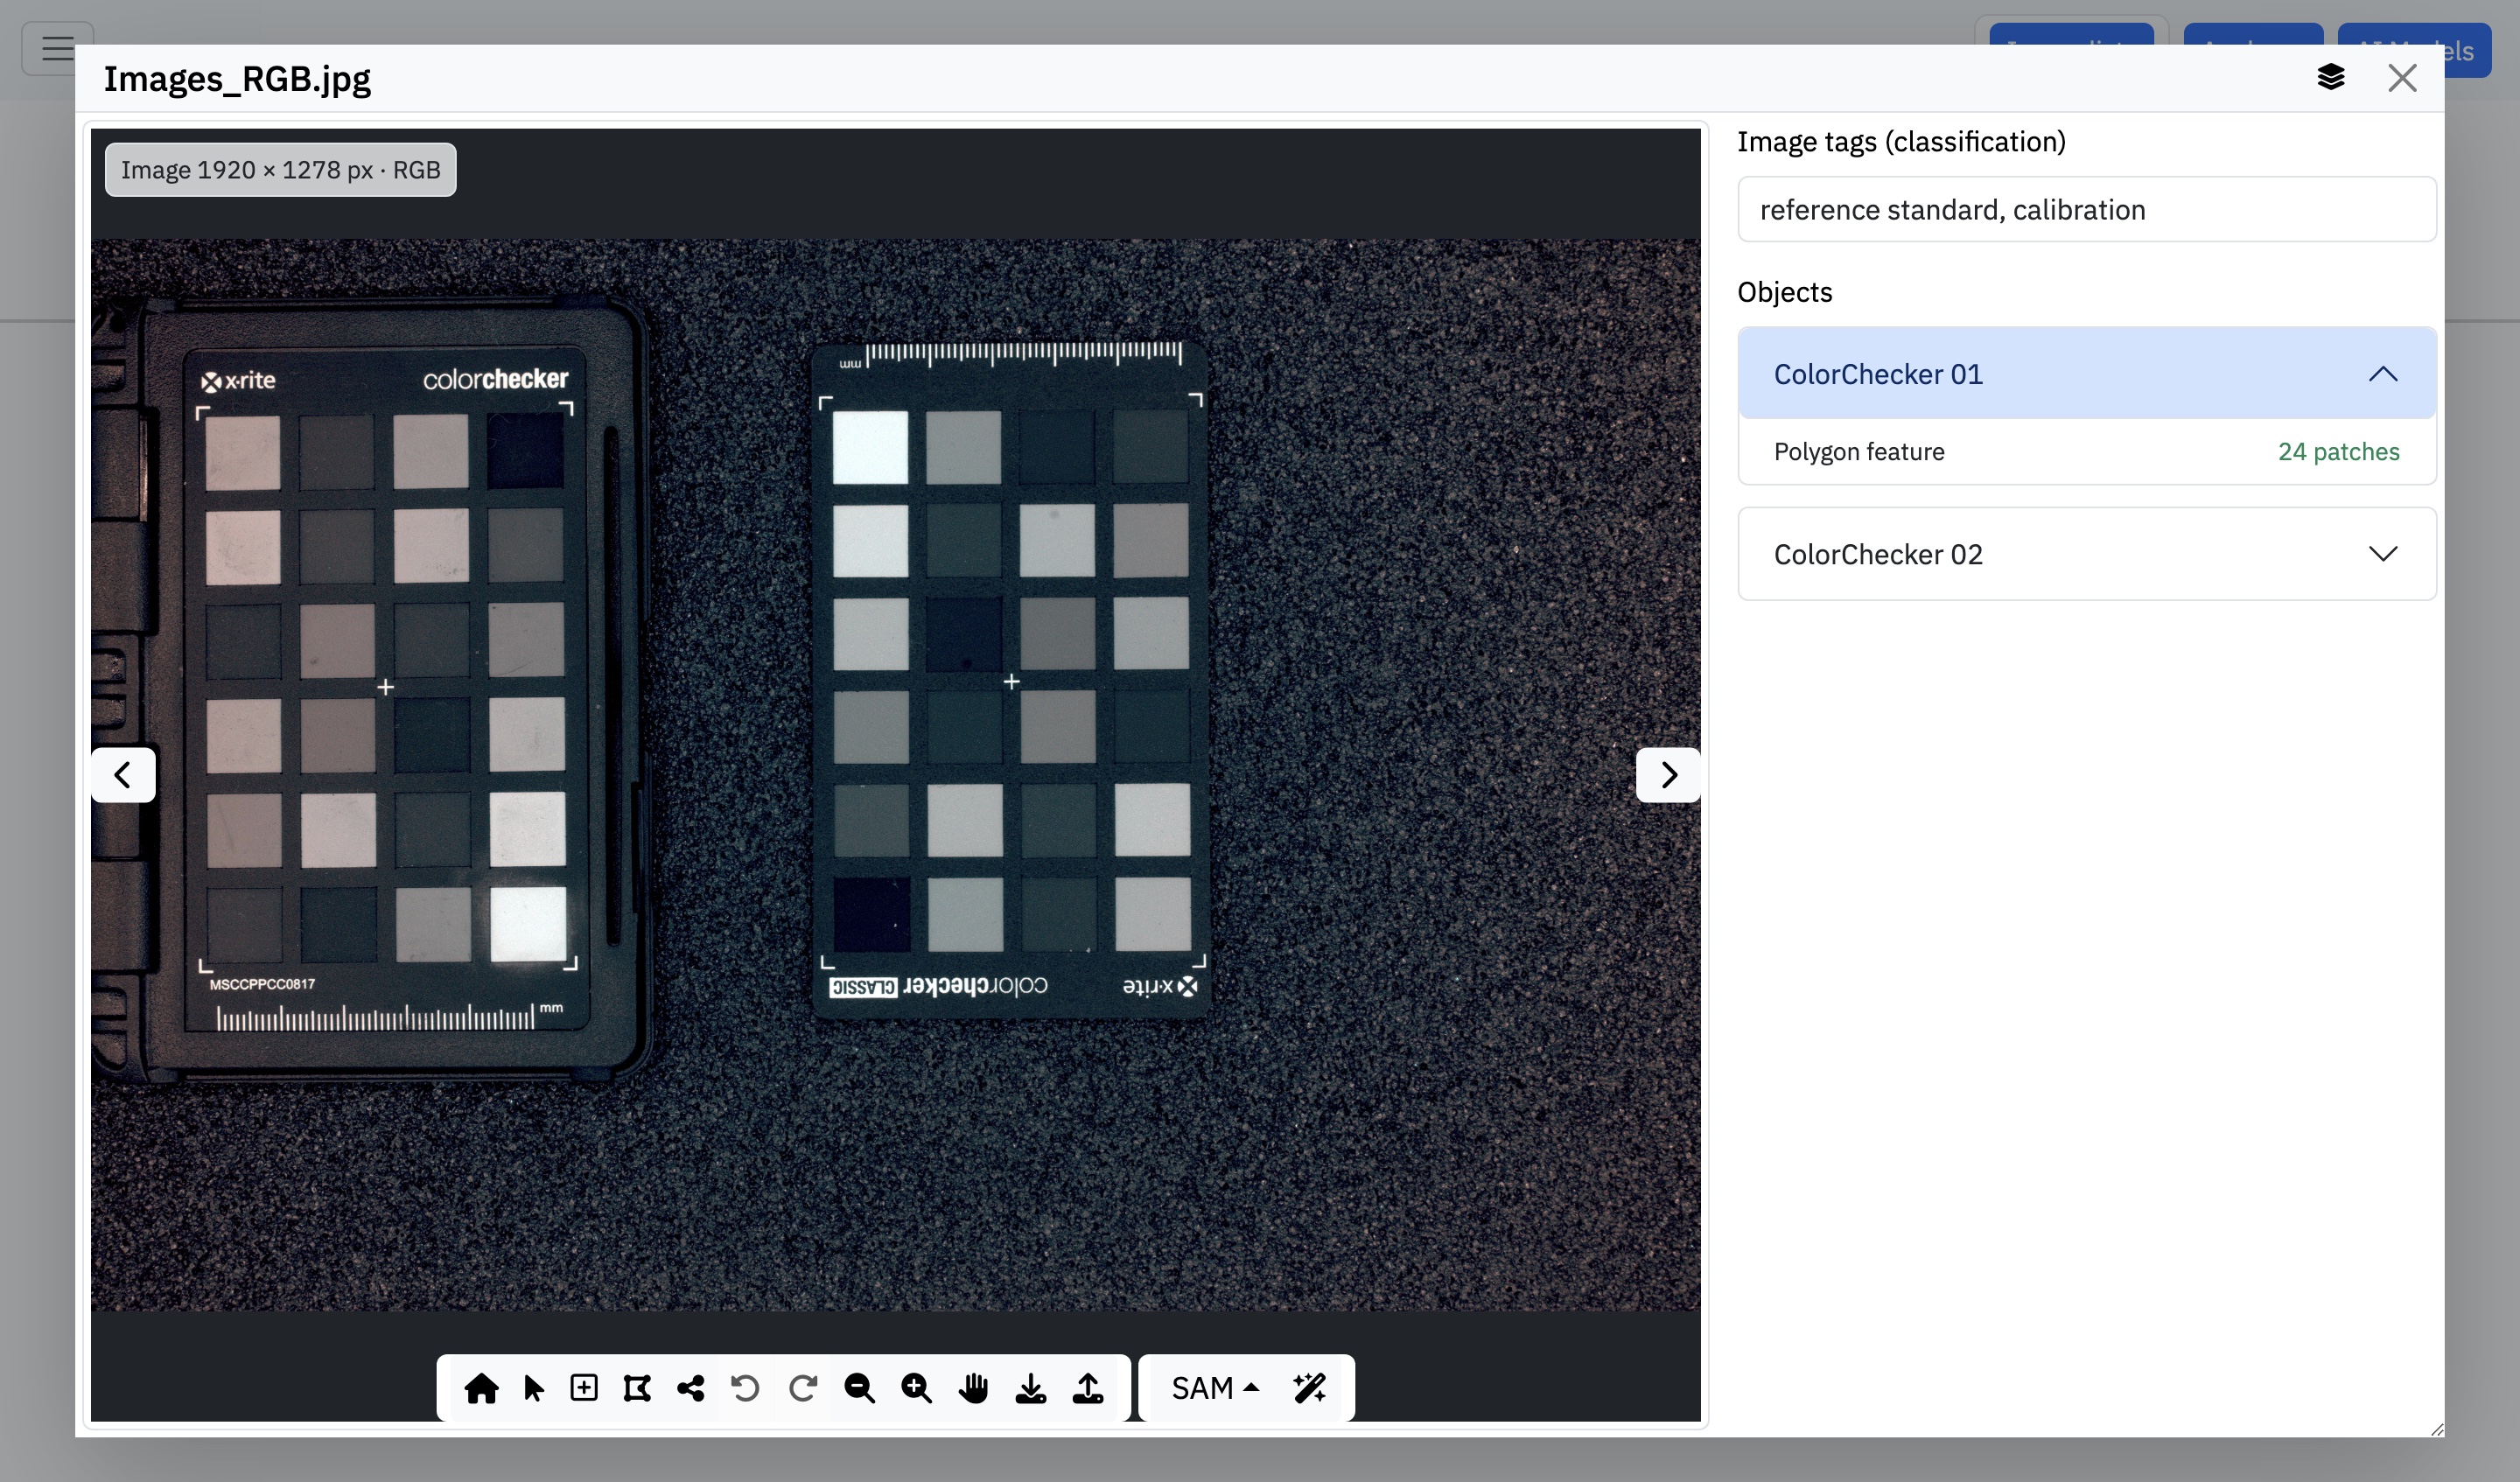
INTERFACE REAL · ANALYZE IMAGES
The actual Argiope interface showing a ColorChecker image, annotation tools, SAM model selection, tags, and an object list.
Argiope screenshot · object viewer and editor
01Desktop suite
for image science
02Multiple images
analyzed in batches
03Local AI and services
integrated into the workflow
04Results ready
for statistics
DISCOVER ARGIOPE

See the software
in action.

Discover Argiope’s key features and see how it applies AI to segmentation and multi-image analysis, with standardization available whenever needed.

Watch on YouTube
INTRODUCTION VIDEOARGIOPE SOFTWARE
YOUTUBE PLAYLIST

Learn Argiope
step by step.

Explore the tutorial collection and learn to use the software’s features in practice.

View all tutorials
INDEPENDENT MODULES

AI to scale.
Analysis to discover.

Start with analysis, segmentation, or standardization. Each module works independently and adapts to your research question.

// SEGMENT

One prompt.
Multiple images segmented.

Apply AI to entire image datasets. Argiope uses SAM, zero-shot segmentation, and Roboflow models to locate objects and turn outlines into measurable regions.

✦ ZERO-SHOTDescribe the object. AI finds it.Segment or detect with a word or short description—without building and training your own model.
  • Multi-image processing
  • Zero-shot segmentation and detection
  • Automatic AI classification
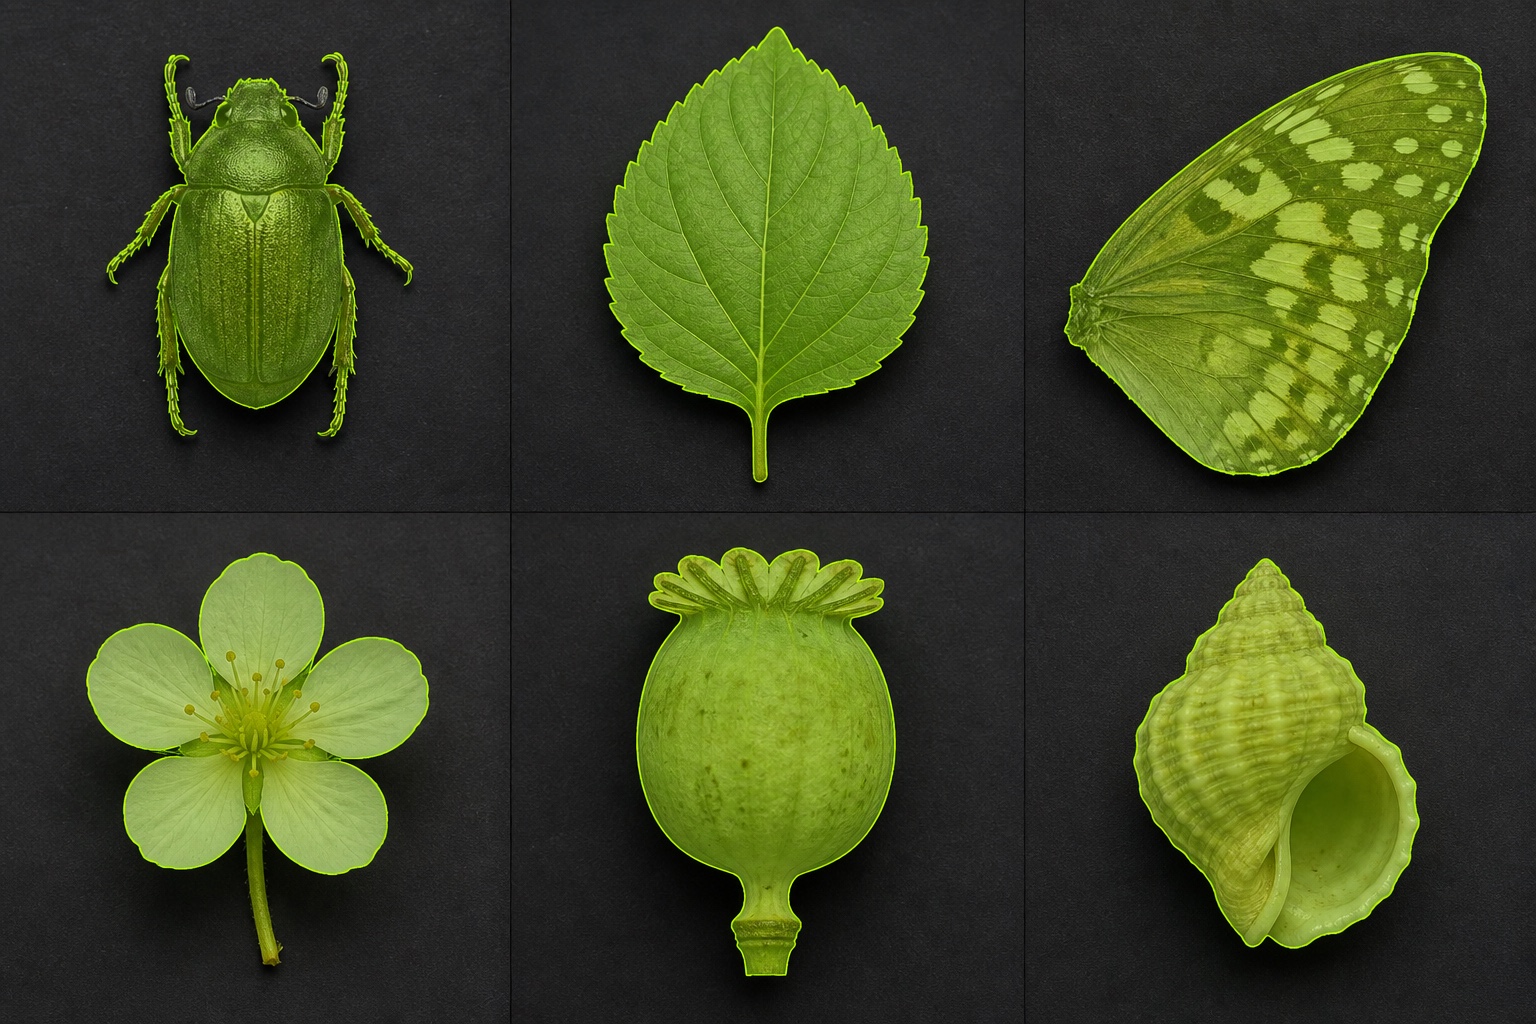
Six scientific specimen photographs—beetle, leaf, butterfly wing, flower, fruit, and shell—with segmentation masks and outlines.
VISUAL EXAMPLESObjects with segmentation masks
// ANALYZE

Analyze hundreds of objects at once.

Select multiple images and run quantitative analyses in batches. Each object generates export-ready data on shape, area, intensity, spectral channels, and spatial patterns.

ƒ(x) · USER FORMULASWrite your own analysis.(R - G) / (R + G)Combine channels, operators, comparisons, and statistical functions to create custom metrics.
StatisticsShape descriptorsPCAMoran's IK-MeansGMM
// STANDARDIZE

Standardize when comparison requires it.

As an optional, independent module, convert RAW photographs into calibrated values, align channels, and compose multispectral images.

YOU CHOOSE THE PATH

Segment in batches.
Analyze at scale.

The modules are independent. Import images and start with the exact capability that answers your question.

  • IA

    Batch zero-shot

    Describe what you are looking for and find or segment objects across multiple images, with no prior training.

    ZERO-SHOT · SAM · NO MODEL TRAINING
  • Σ

    Analyze directly

    Run metrics on image datasets or write your own analysis formulas.

    SHAPE · SPECTRUM · PCA · FORMULAS
  • OPT

    Standardize if needed

    Use calibration and alignment only when your experimental design requires them.

    OPTIONAL, INDEPENDENT MODULE
  • Export the results

    Continue in R, Python, Excel, or your preferred statistical environment.

    TXT · JSON · COCO · IMAGEJ ROI
BUILT WITH RESEARCH, FOR RESEARCH

Your subject changes.
Rigor remains.

From color patterns to spectral signatures, Argiope was designed for different organisms, materials, scales, and questions.

Visual ecologyPhenotypingTaxonomyMaterials scienceAgronomyConservation
HYPERSPECTRAL CUBE400–1000 nm
UVVISIBLENIR
nchannels
32-bitdepth
localprocessing
“Quantify the visible—and reveal
what the eyes cannot reach.

Argiope is developed at the University of Brasília with funding from FAPDF, bringing software engineering and applied scientific research together.

COMPLETE DOCUMENTATION

From first launch
to results.

The Help Center brings together the complete Argiope tutorial, explains every tool, and lets you search for any term.

Open Help Center
FREQUENTLY ASKED QUESTIONS

Before you
begin.

Couldn’t find your answer? Talk to the team on GitHub ↗

What types of images does Argiope process?

Argiope works with RGB, multispectral, and hyperspectral images. The standardization workflow accepts RAW files from several manufacturers and lets you combine captures into multichannel images.

What are multispectral and hyperspectral images?

Multispectral images capture an object in a few specific spectral bands, such as ultraviolet, visible light, and infrared. Hyperspectral images capture dozens or hundreds of narrow, continuous bands, creating a detailed spectral signature for every pixel. Argiope lets you view, combine, and analyze the channels of both image types.

Do I need programming skills?

No. The main workflows are visual. Results can be exported if you want to continue the analysis in R, Python, Excel, or other statistical software.

How is artificial intelligence used?

Integrated models can segment objects, detect reference patterns, and classify images. Local options and optional Roboflow and Gemini integrations are available.

What is zero-shot?

Zero-shot is a way to use artificial intelligence without training a model specifically for your image dataset. Describe the object you want in words—such as “butterfly wing” or “leaf”—and Argiope can detect or segment those objects in one or multiple images.

Can I write my own analysis formulas?

Yes. Argiope lets you create custom metrics using image channels, mathematical operations, comparisons, and functions such as mean, median, standard deviation, sum, and count. For example, (R - G) / (R + G) calculates a normalized difference for the pixels in each object.

Can I use it for academic research?

Yes. The software uses the PolyForm Strict License 1.0.0 for noncommercial uses. Review the full terms and citation guidance before publishing.